Substack is one of the fastest-growing newsletter platforms, with more than 35 million active subscriptions and over 5 million paid subscriptions. It has also become a major source of income for thousands of independent writers.
In this article, we’ll cover the latest Substack statistics, including users, paid subscriptions, audience demographics, revenue, and funding.
Key Substack Statistics 2026
- Substack has over 35 million active subscriptions.
- Substack has more than 5 million paid subscriptions.
- Nearly 100,000 publications earn money on Substack.
- Substack brought in about $45 million in revenue in 2025.
- In August 2026, the platform had around 175.9 million visits.
How Many People Use Substack?
Substack had around 20 million active subscribers in May 2025. Now, that number’s climbed to roughly 35 million.
However, these numbers refer to active subscriptions rather than unique users. Since one person can subscribe to several newsletters, the total number of subscriptions may be higher than the number of people using the platform.
Substack Paid Subscriptions & Growth Over Time
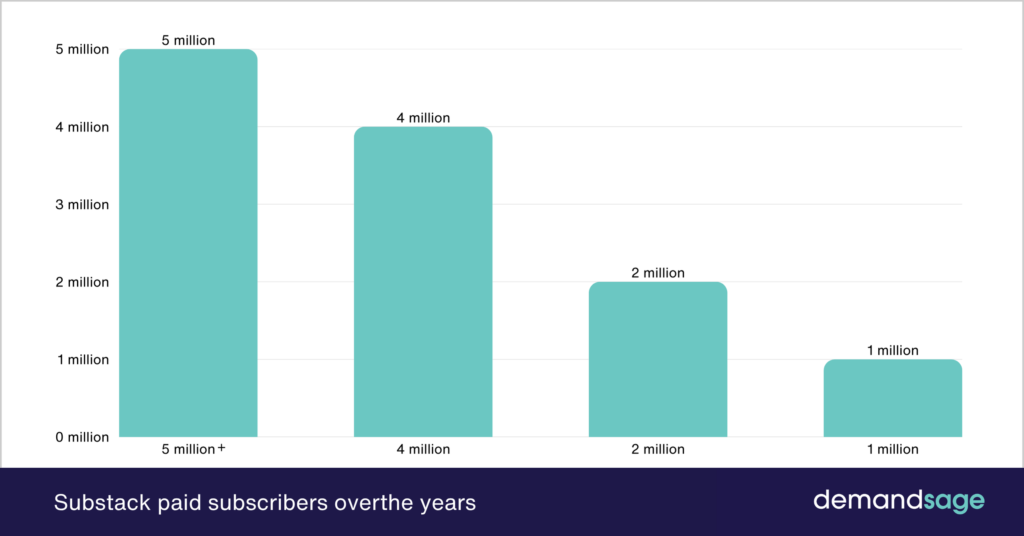
As per the latest data, Substack has over 5 million paid subscribers, up from 2 million in 2023. The platform has shown accelerating growth, especially in recent years.
It took Substack several years to reach its first million paid subscriptions, from its inception in 2017 to late 2021, and roughly another two years to hit 2 million.
Growth then accelerated sharply: the platform added its fourth million by November 2024 and crossed 5 million just months later, by March 2025.
The table below shows paid subscriptions climbing over time.
| Year | Paid Subscriptions |
|---|---|
| March 2025 | 5 million+ |
| November 2024 | 4 million |
| 2023 | 2 million |
| November 2021 | 1 million |
Substack Audience Demographics
Substack audience is mostly made up of working professionals rather than teenagers.
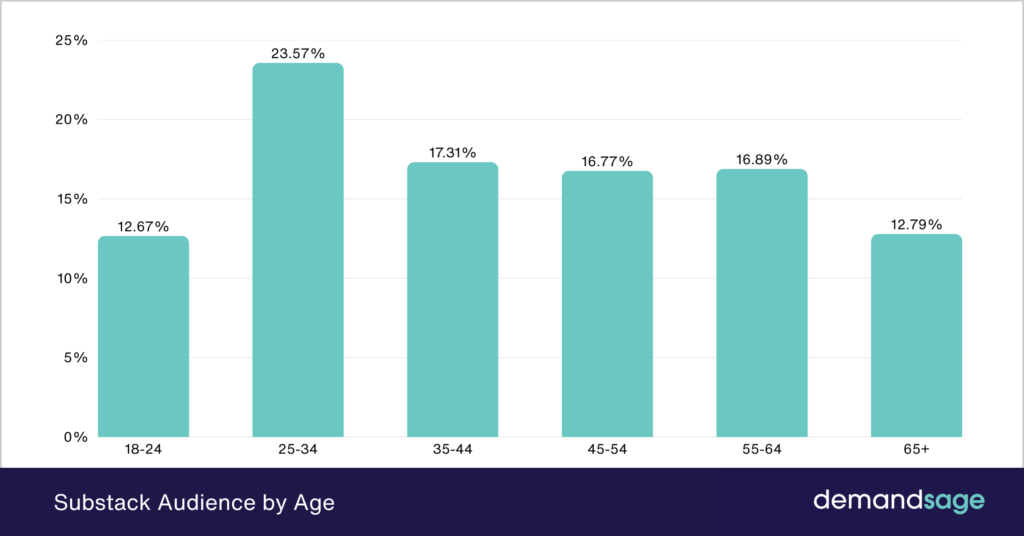
However, readers are spread evenly across the 25 to 64 age range. This gives writers a broad audience to reach.
Substack Audience by Age
Readers aged 25 to 34 make up the largest group at 23.57%. Together, users aged 25 to 54 account for 57.65% of the audience.
Here’s a breakdown of Substack users by different age groups.
| Age Group | Share of Users |
|---|---|
| 18-24 | 12.67% |
| 25-34 | 23.57% |
| 35-44 | 17.31% |
| 45-54 | 16.77% |
| 55-64 | 16.89% |
| 65+ | 12.79% |
Source: Similarweb
Substack Audience by Gender
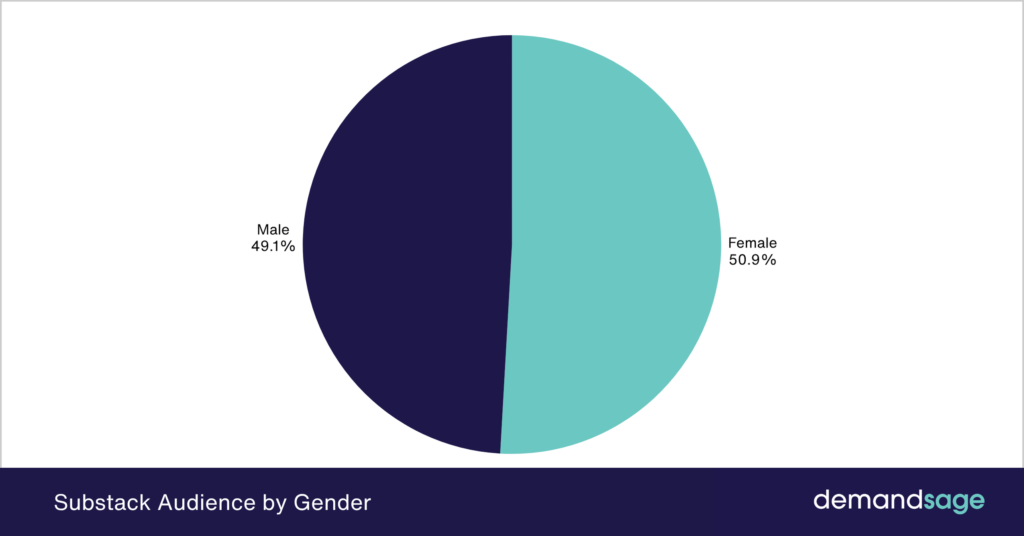
Women make up 50.9% of Substack’s audience, while men account for 49.1%. The split is almost 50-50, so Substack attracts men and women in equal numbers.
| Gender | Share of Users |
|---|---|
| Female | 50.9% |
| Male | 49.1% |
Source: Similarweb
How Much Do Substack Writers Earn?
Substack is now a source of income for a lot of writers. By April 2026, almost 100,000 publications were making money through the platform.
That is around twice the number from a year earlier, when about 50,000 publications were monetizing. Of the current total, roughly 30,000 are outside the US. Back in 2023, more than 17,000 writers had received payments from Substack.
The earning potential can also be significant at the top. The top ten authors on Substack collectively make more than $40 million a year.
Source: Substack, Axios, Backlinko
Highest-Earning Substack Newsletters
Letters from an American by Heather Cox Richardson is one of Substack’s top earners, bringing in about $5 million a year.
The table below shows some of the highest-earning newsletters.
| Newsletter | Est. annual revenue |
|---|---|
| Letters from an American | $5,000,000 |
| The Pragmatic Engineer | $1,500,000 |
| Lenny’s Newsletter | $1,500,000 |
| Citrini Research | $1,250,000 |
| The Bulwark | $1,025,000 |
| Noahpinion | $1,000,000 |
| Silver Bulletin | $1,000,000 |
| Meidas+ | $1,000,000 |
| Public | $1,000,000 |
| Chamath Palihapitiya | $1,000,000 |
| The Fifth Column | $1,000,000 |
| Slow Boring | $812,500 |
| The Preamble | $812,500 |
| Thinking About… | $812,500 |
| The Forgotten Side of Medicine | $812,500 |
| Whitepaper.mx | $812,500 |
| Tipping Point Prophecy Update | $812,500 |
| Vale Tutto – di Selvaggia Lucarelli | $750,000 |
| Zeteo | $750,000 |
| The Contrarian | $750,000 |
| Racket News | $750,000 |
| The Warning with Steve Schmidt | $750,000 |
| The Message Box | $750,000 |
| Capital Wars | $750,000 |
| Eliant’s Exploits | $725,000 |
| The Isolation Journals | $600,000 |
| The Good in Us by Mary L Trump | $600,000 |
| Proof | $600,000 |
| Unreported Truths | $600,000 |
| Serious Trouble | $600,000 |
| Big Salad | $600,000 |
| Blocked and Reported | $550,000 |
| Steady | $512,500 |
| House Inhabit | $500,000 |
| The Borowitz Report | $500,000 |
| Civil Discourse with Joyce Vance | $500,000 |
| Robert Reich | $500,000 |
| Popular Information | $500,000 |
| The Weekly Dish | $500,000 |
| Hopium Chronicles By Simon Rosenberg | $500,000 |
Source: Substack, Press Gazette, Press Gazette 2
Substack Traffic and Engagement Statistics
In September 2025, Substack recorded 47.6 million visitors, up 65.85% from the previous year.
Now, in August 2026, Substack had around 175.9 million visitors, pointing to continued growth in readership and engagement.
Source: Backlinko, Similarweb
Substack Traffic by Country
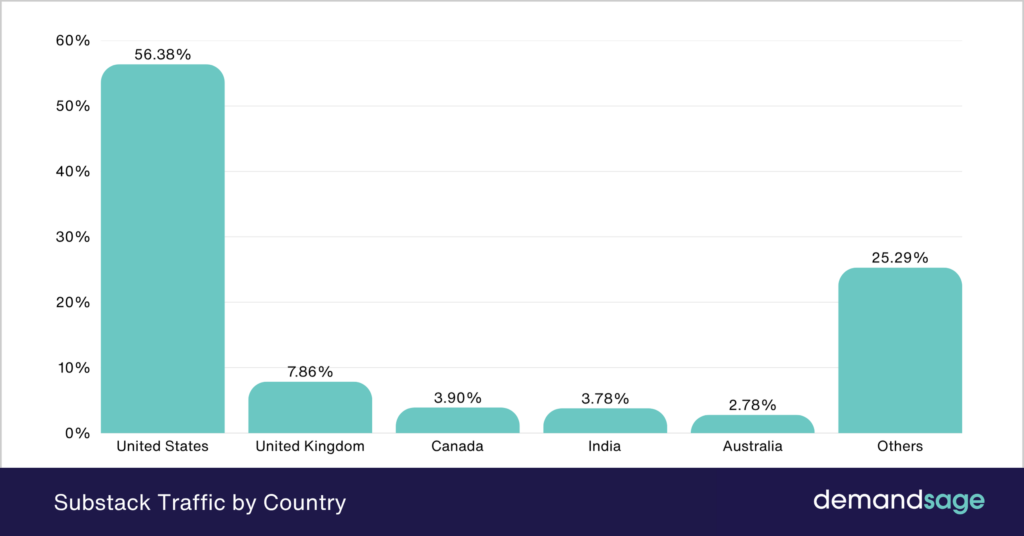
The United States accounts for more than half, around 56.38%, of Substack’s traffic. The rest comes mainly from other English-speaking countries, along with a growing audience in India.
Here’s the breakdown of Substack traffic from different countries.
| Country | Share |
|---|---|
| United States | 56.38% |
| United Kingdom | 7.86% |
| Canada | 3.9% |
| India | 3.78% |
| Australia | 2.78% |
| Others | 25.29% |
Source: Similarweb
Substack Engagement Statistics
Visitors spend about four minutes on Substack per visit. That suggests readers are spending time reading the content instead of simply visiting one page and leaving.
The table below presents some Substack engagement statistics.
| Metric | Value |
|---|---|
| Monthly Visits (Aug 2026) | 175.9 million |
| Bounce Rate | 47.32% |
| Pages per visit | 4.04 |
| Visit Duration | 4 minutes 3 seconds |
Source: Similarweb
Substack Engagement by Devices
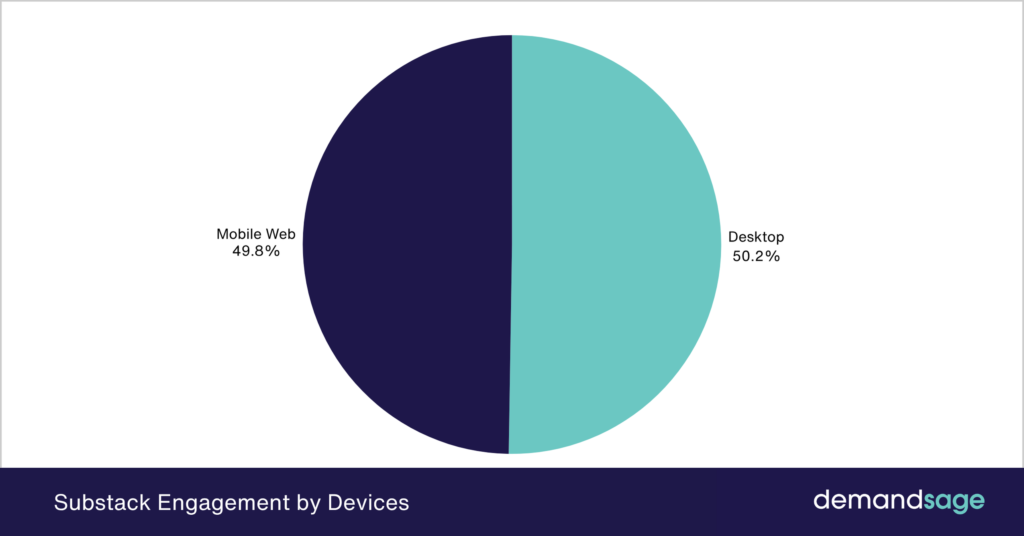
Substack traffic is split almost evenly between desktop and mobile web. Desktop accounts for 50.25%, while mobile web makes up 49.75%.
| Device | Engagement Share |
|---|---|
| Desktop | 50.25% |
| Mobile Web | 49.75% |
Source: Similarweb
Substack Revenue and Earnings Statistics
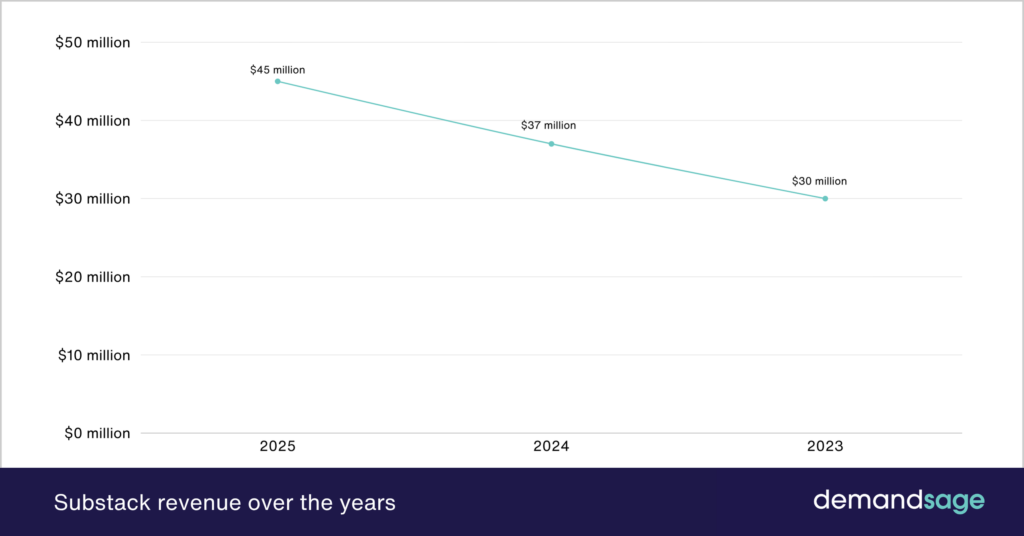
Substack made about $45 million in revenue in 2025, compared with $30 million in 2023.
The platform takes a 10% commission on paid subscriptions. So, if writers bring in around $450 million from paid subscriptions, Substack would keep roughly $45 million.
Payment processing is charged separately. Stripe takes about 2.9% + $0.30 per transaction (plus a small recurring billing fee) on top of Substack’s cut, so writers ultimately keep around 87% of what readers pay.
Here’s how Substack revenue has grown over the years.
| Year | Revenue |
|---|---|
| 2025 | $45 million |
| 2024 | $37 million |
| 2023 | $30 million |
Substack Revenue by Genres
US politics brings in much more revenue than any other genre, with an estimated $18.61 million. Finance, news, and technology follow behind.
Here’s the estimated Substack revenue by different genres.
| Genre | Revenue |
|---|---|
| US Politics | $18.61M |
| Finance | $3.23M |
| News | $2.91M |
| Health Politics | $2.91M |
| Technology | $2.50M |
| Business | $2.50M |
| Culture | $2.40M |
| Food & Drink | $2.00M |
| World Politics | $810K |
| Faith & Spirituality | $810K |
| Fashion & Beauty | $600K |
| Science | $500K |
| Literature | $500K |
| History | $500K |
If you write about politics, finance, or tech, you’re writing where the paying readers already are.
Source: Press Gazette
Substack Funding & Valuation Statistics
Substack raised $100 million in July 2025, at a $1.1 billion valuation, making it a unicorn company.
The Series C round was led by BOND and The Chernin Group. Since 2017, Substack has raised close to $200 million in total funding.
Here’s a look at Substack’s funding history.
| Year | Funding Amount | Valuation | Round |
|---|---|---|---|
| July 2025 | $100 million | $1.1 billion | Series C |
| May 2023 | $3.29 million | $585 million | Community round (Wefunder) |
| March 2021 | $65 million | $650 million | Series B |
| July 2019 | $15.3 million | – | Series A |
| May 2018 | $2 million | – | Seed |
| February 2018 | $125K | – | Seed |
Source: Tracxn, Sacra, TechCrunch