A social media competitor analysis is a structured review of how rival brands perform on social platforms: what they post publicly, the engagement and audience it earns them, and their share of voice against yours. Run it to find the content gaps worth taking and to benchmark your own results.
Your own numbers don’t mean much on their own, and a social media competitive analysis is what supplies the comparison. It also shows which formats rivals have already tested, so your social media calendar isn’t running on guesses.
In this article, you will learn:
- How to pick which competitors are worth tracking, and how many
- The five-step framework, and what each network exposes about a competitor
- The metrics that make a comparison mean something
- The tools, and what they actually cost
A social media competitor analysis is a structured comparison of what your competitors publish on social media and how their audiences respond, measured against your own accounts over the same window. Social media competitive analysis is the same practice under a different name, and the two phrases get used interchangeably.
It’s a narrower job than three exercises it often gets filed with:
- A social media audit looks at your own accounts: what you’ve published, what performed, where the profiles are thin. The subject is you.
- Social listening tracks mentions and sentiment across public conversation, including the conversation that never lands on a competitor’s profile.
- Competitive analysis in the general sense covers a rival’s whole business, from pricing to product positioning. The social version is the slice built on public social data.
The payoff is context. A dip in your engagement rate reads one way if your competitors held steady, and another if the whole category slid with you. It also sets the scope of the job: an analysis built on the one or two networks you post to most describes a fraction of where your audience actually meets your competitors.
How to choose which competitors to track
Track 3 to 5 competitors, not every account in your category. Mix business rivals with the accounts quietly winning your audience’s attention, and rebuild the list every six months as new entrants show up.
- Direct competitors. Same product, same buyer. Your sales team can name them without looking.
- Content competitors. They sell something else, or nothing at all, and still take the attention you’re after: a creator or a trade publication your audience reads daily.
- Disruptors. Newer accounts growing fast on a format you haven’t touched yet.
Follower overlap and each network’s topic search will surface content competitors faster than a market map will. The platforms won’t build the list for you: Meta’s own benchmarking measures you against an anonymous category set you don’t choose, as the network breakdown below sets out.
The ceiling is there for comparability. Every competitor you add has to be tracked the same way on the same schedule, or the numbers stop lining up.
The 5-step social media competitive analysis framework
A social media competitive analysis runs in five steps: choose three to five competitors, decide which networks to watch, audit what they publish, measure the numbers over a fixed window, and find the gaps worth acting on. Steps one and two only set the scope. The work that changes your content calendar happens in steps three and five.
1. Identify your competitors
Work from the shortlist above: three to five brands, weighted toward the ones competing for the same attention rather than the same customer.
For example, imagine you run an online meal-planning app for busy parents. Your direct competitors might be other meal-planning or recipe apps. But a parenting publication, or a healthy food creator could also be an attention competitor if your target audience regularly turns to them for quick dinner ideas and family meal inspiration.
The distinction matters because social media competition is broader than product competition. You are not only competing for a purchase. You are also competing for the clicks, follows, shares, and attention of the same audience.
A useful competitor shortlist can include:
- 2–3 direct competitors: brands solving the same problem with a similar product or service.
- 1–2 attention competitors: brands targeting the same audience or publishing content around the same topics, even if they sell something different.
If you are unsure who belongs on the list, double-check your assumptions. Search for the main problem your product solves, your core topic, or phrases your audience might use.
For example, you could ask, “what are the top tools for weekly meal planning?” or search “best meal-planning apps for families.” The brands that consistently appear can give you a useful starting point for competitors to investigate further.
Treat those results as discovery, not a final ranking. Review each brand yourself and keep the ones that genuinely compete for the same audience and attention.
2. Select the networks that matter
Choose the networks where your audience is active and where each competitor posts often enough to produce a pattern.
A brand that published four times on X all year gives you nothing to analyze. Every network also exposes a different amount to an outsider, which the next section breaks down.
3. Audit their content
Audit your own accounts first. A social media audit gives you the baseline you are comparing against, and without one you are collecting competitor numbers with nothing to hold them against. Then work the same checklist for every competitor on the list:
- Networks they are genuinely active on, and the ones they have quietly abandoned
- Posting cadence per network, counted in posts per week
- Content mix by format: video, carousel, static image, native document, link post
- Value propositions and the messaging they lead with
- Publicly stated pricing and packaging
- Distribution channels beyond social: newsletter, community, partnerships, paid
- Reach signals, including customer counts and traffic estimates
One noun phrase per row per competitor: a spreadsheet you can sort beats a document you have to read.
4. Measure the numbers
Pull the same metrics, over the same date window, for every account on the list, your own included. Read them against published social media benchmarks before drawing a conclusion.
Median engagement runs several times higher on TikTok than on Instagram in Quid’s 2026 benchmark report, so the same rate means opposite things on the two networks.
5. Find the gaps
You are looking for absences:
- A question their comment sections answer that your content ignores
- A network where nobody in your category has shown up yet
A gap earns a place on the calendar when you can name what is missing and why it exists, and when you have the capacity to fill it consistently. Write each gap down with the evidence behind it, so the next round can test whether closing it worked.
What each network actually exposes about a competitor
Every network shows a different slice of a competitor’s activity, and none of them hands you their analytics.
GWI data puts the typical user on 6.5 platforms a month, with past-month reach within 1.7 points across Facebook (56.3%), YouTube (55.3%) and Instagram (54.6%).
An audit built on two networks misses most of what your competitor is doing.
Facebook and Instagram
Named competitors. You don’t choose who you’re measured against and you never see an individual competitor’s numbers.
TikTok
Organic per-account analytics, which stay own-account only.
Free Company Pages track one competitor and Premium subscribers track up to nine.
YouTube
Precision. subscriberCount is rounded down to three significant figures, commentCount is deprecated, and videoCount covers public videos only.
X
Account-level analytics, which aren’t publicly readable for another account.
What’s visible
What it doesn’t give you
Named competitors. You don’t choose who you’re measured against and you never see an individual competitor’s numbers.
What it doesn’t give you
Organic per-account analytics, which stay own-account only.
What it doesn’t give you
Free Company Pages track one competitor and Premium subscribers track up to nine.
What it doesn’t give you
Precision. subscriberCount is rounded down to three significant figures, commentCount is deprecated, and videoCount covers public videos only.
What it doesn’t give you
Account-level analytics, which aren’t publicly readable for another account.
The metrics that make a competitor comparison mean anything
Five metrics carry a social media competitor analysis: engagement rate, share of voice, posting cadence, content mix by format, and audience growth velocity. Each one is only comparable when the method behind it is stated.
Engagement rate
Engagement rate is total interactions divided by an audience number, as a percentage. The denominator decides the answer, so one post scores three ways:
- Divided by followers. Counts likes, comments, favorites, reposts, shares, reactions, and video interactions over followers.
- Divided by reach. Scores against people who saw the post, flattering small accounts with strong distribution.
- Divided by impressions. LinkedIn’s own formula, which is why LinkedIn percentages sit an order of magnitude above Instagram’s.
Pin the denominator before comparing anyone. Our social media metrics guide covers the families these sit in.
Why social media engagement benchmarks vary by source
Quid / Rival IQ 2026
2.01%
Quid / Rival IQ 2026
0.30%
Quid / Rival IQ 2026
0.03%
Quid / Rival IQ 2026
0.21%
Socialinsider 2026
No data
Quid / Rival IQ 2026
0.04%
Quid and Socialinsider report different engagement-rate benchmarks for the same platforms. That does not make either dataset useless.
It shows why social media benchmarks should be treated as reference ranges rather than universal targets: the results change depending on the sample, methodology, industries included, and how engagement is calculated.
Sources: Quid’s 2026 report — medians from 150 companies drawn at random in each of 18 industries & Socialinsider’s 2026 benchmarks — 70-million-post sample across TikTok, Instagram, Facebook, and X.
Share of voice on social media and how do you calculate it?
Social media share of voice measures how much of the conversation around your category belongs to your brand compared with the competitors you track.
The basic formula is: Share of voice = your brand mentions ÷ total mentions across your tracked competitor set × 100
For example, if your brand receives 250 mentions and the brands in your comparison set receive 1,000 mentions in total, your share of voice is 25%.
For the comparison to mean anything, keep three things consistent:
- Competitor set: compare against the same group of brands.
- Time period: measure mentions over the same fixed window.
- Platforms: include the same social networks in every comparison.
Also document where the mention data comes from, typically a social listening tool. Coverage and data collection methods can vary between tools, so results from different providers may not be directly comparable.
There is no single universally adopted standard for calculating social media share of voice. Different tools and reports may define the metric differently, so state your formula, competitor set, platforms, time period, and data source whenever you report it.
The three quieter metrics
- Posting cadence. Posts per week per platform.
- Content mix by format. How much of a competitor’s output is video, carousel, image, or text. It shows what they’re betting on.
- Audience growth velocity. Followers added per month as a percentage of base. It reads intent earlier than raw follower counts.
How to act on what the analysis tells you
A competitor analysis only pays off when it surfaces white space: a gap in the set you track that you can actually take.
Three kinds are worth writing down, and each belongs in your social media strategy while the research is still true.
- Format gaps. A format nobody in the set uses. If they all ship the same static graphic, the first carousel in the category is yours.
- Topic gaps. A question nobody answers, usually sitting in the comments under their posts.
- Cadence gaps. A rhythm nobody sustains. Accounts that post daily for six weeks, then go quiet, leave the slot open.
Some gaps only show up in conversation. Interview your competitors’ customers so you can understand:
- What’s their main problem?
- How does your competitor’s product or service help them?
- What’s their biggest pain with it?
- After a demo of your product, how does it compare?
Of the metrics you collect, social media engagement rate is one of the cleanest for comparing competitors because it accounts for audience size. Raw likes, comments, or follower counts do not, so they can make larger accounts look stronger by default.
From there, the analysis becomes actionable. In Planable, a competitor insight can feed directly into your content calendar, where the team can turn it into a dated campaign, review it, approve it, and move it toward publishing.
Can you run a competitor analysis inside your social media tool?
Partly. Planable handles the social-media side of competitor analysis directly inside Analytics, so you can benchmark competitors without moving your reporting workflow into a separate tool.
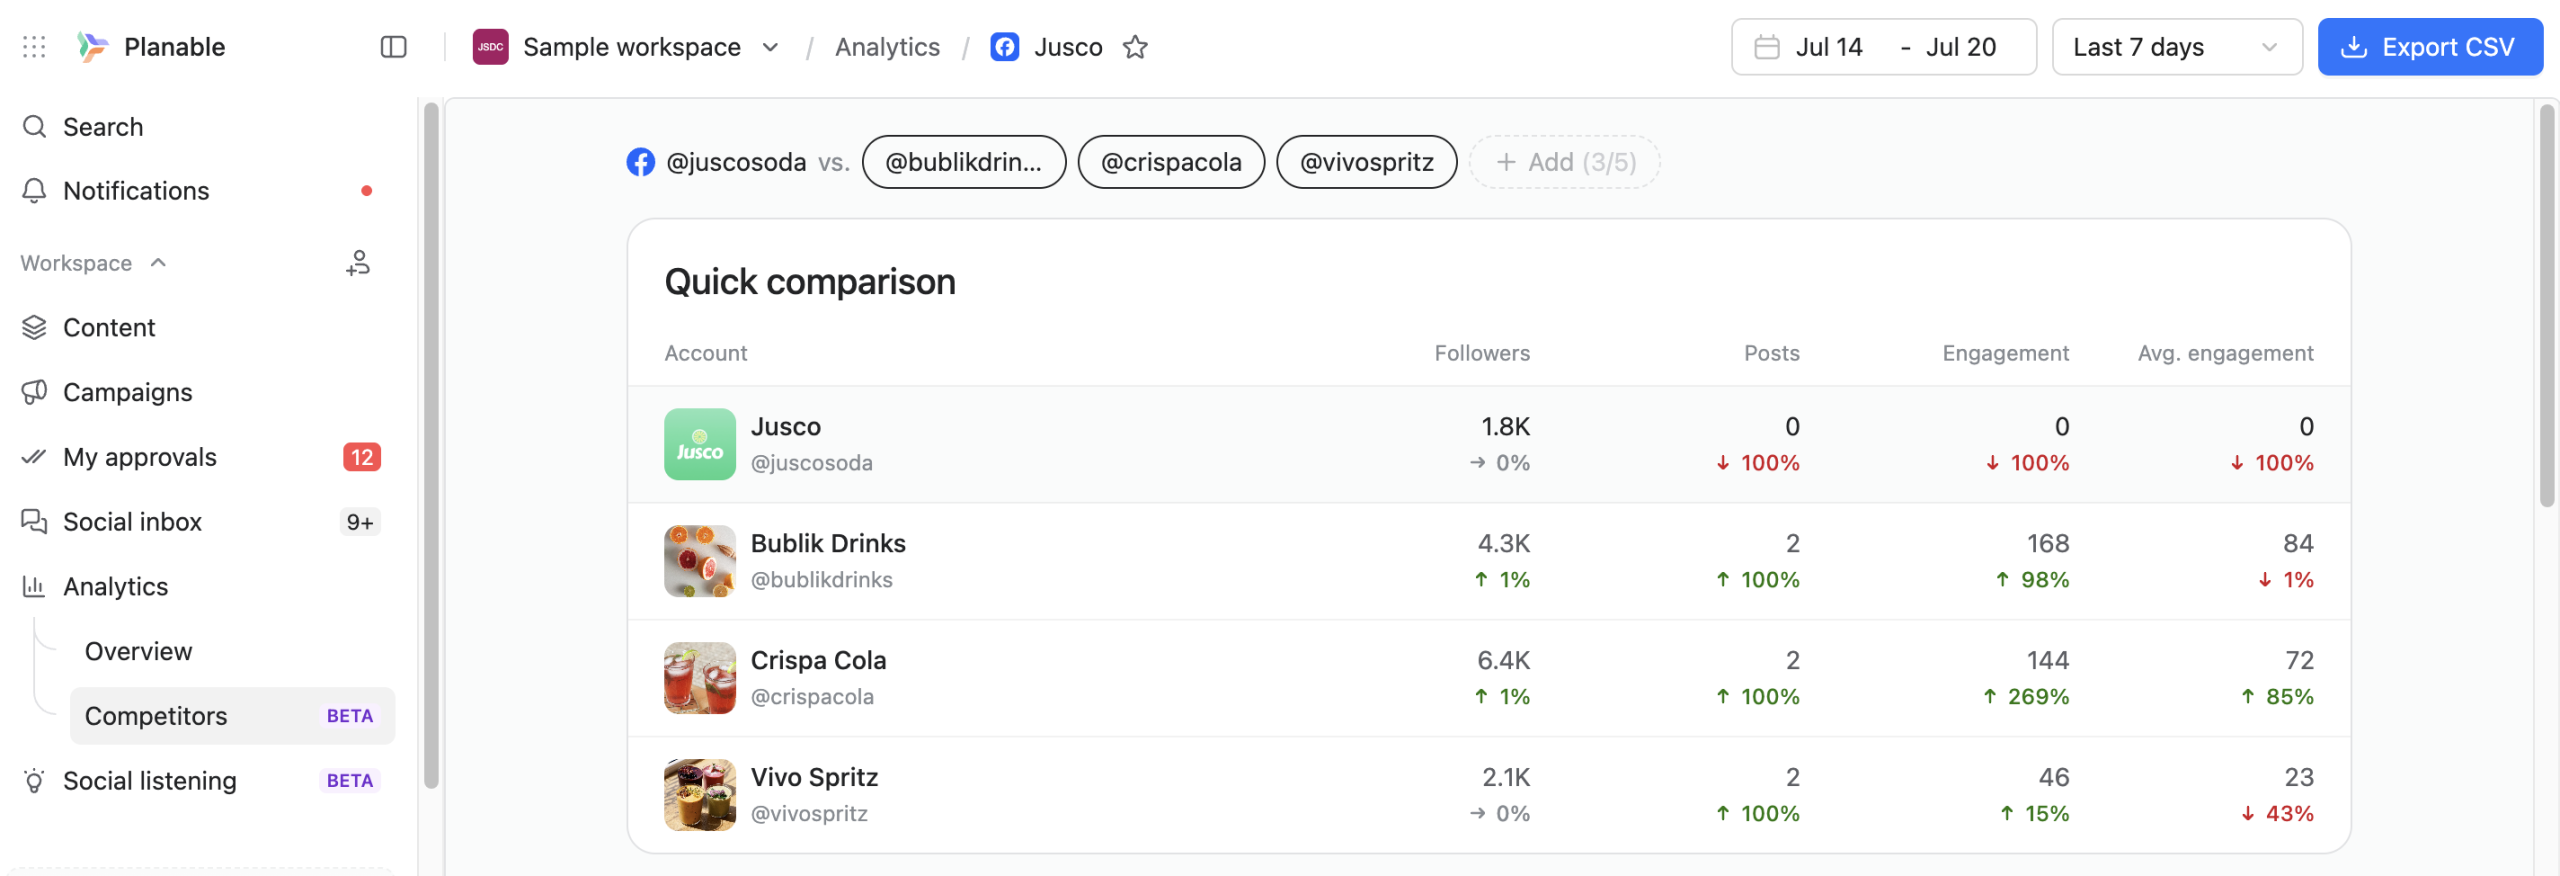
Planable Competitors analytics dashboard
The Competitors tab tracks up to 5 competitor profiles per page across Instagram, Facebook, YouTube, TikTok, and LinkedIn, including both company pages and personal profiles where supported.
Competitor metrics sit alongside your own results for the same date range, which makes it easy to compare performance in context rather than reviewing accounts one by one. The data is refreshed once a day rather than in real time. Daily is the ceiling.
Competitor Analytics is available through the Analytics add-on, priced at $14 per workspace per month.
Planable can also suggest up to 5 relevant competitors for a page based on its public profile, giving you a useful starting point if you have not already built a competitor set. Those suggestions are generated once and cached.
Social Listening adds another layer by tracking the wider conversation around a brand or topic. It monitors public mentions across X, Reddit, the open web, Instagram, Facebook, YouTube, TikTok, and LinkedIn, with AI sentiment applied to individual mentions. Each workspace can track 1 brand keyword and 3 topic keywords.
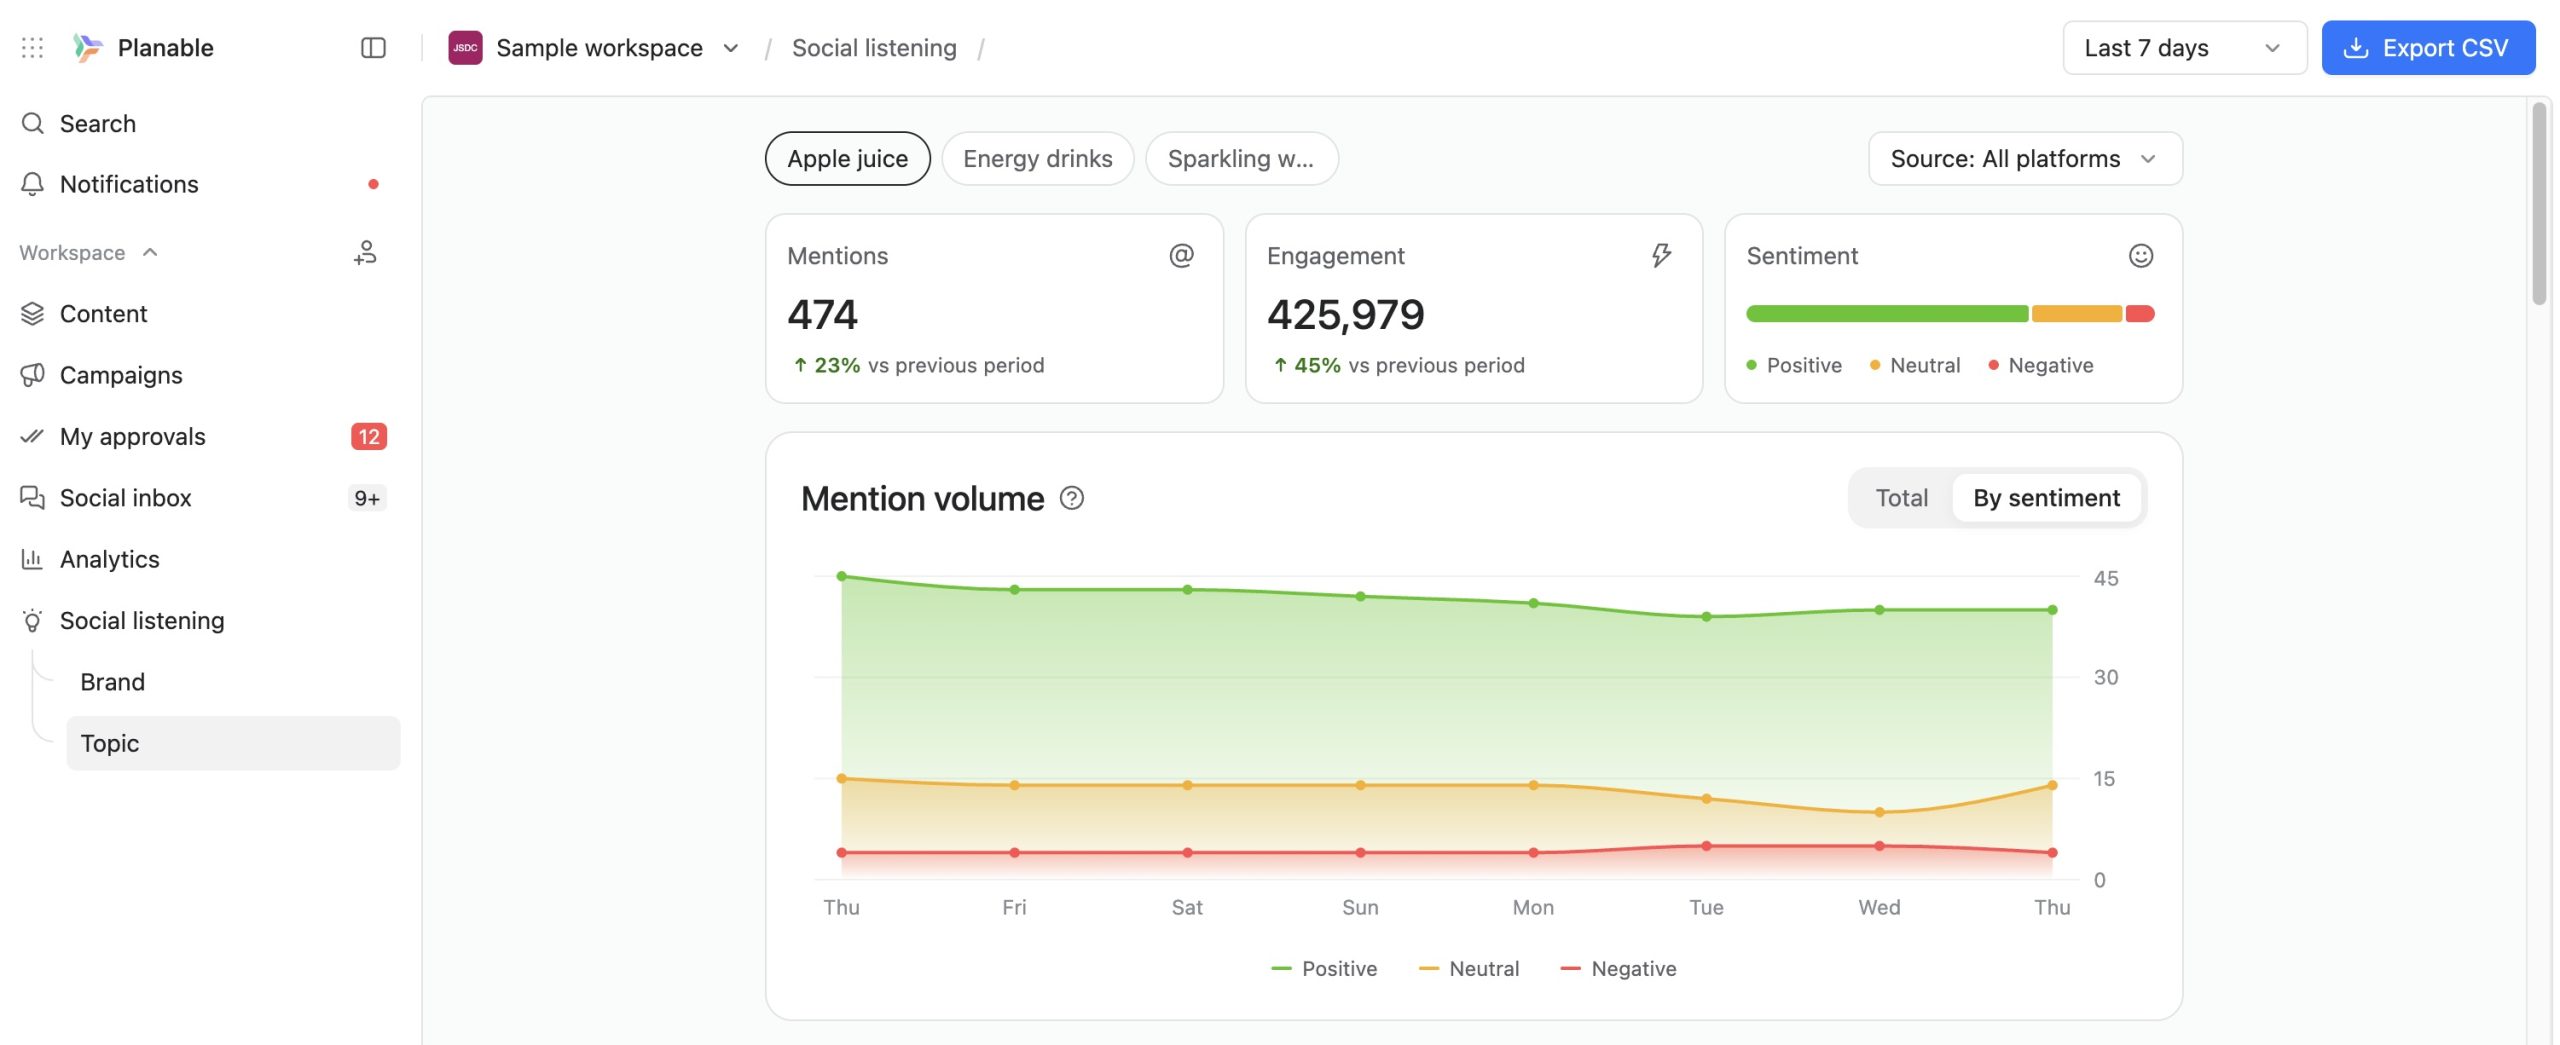
The Social Listening report in Planable, with AI sentiment applied to individual mentions
Together, Competitor Analytics and Social Listening cover two different sides of competitive research: how competing social accounts perform and what people are saying around the brands and topics you care about.
Planable Analytics can turn those comparisons into client-ready reports, exported as a PDF or shared through a link with your own logo.
A social media competitor analysis tool tracks public data from competitors’ social media accounts and compares it with your own performance over the same period. Common metrics include follower growth, posting frequency, engagement, and top-performing posts.
When comparing social media competitor analysis tools, focus on three factors: which social networks they support, what competitive data and benchmarking features they provide, and how much they cost.
For a more detailed evaluation of features, use cases, limitations, and trade-offs, see our roundup of social media competitor analytics tools.
Planable
Instagram, Facebook, YouTube, TikTok, and LinkedIn. Track up to 5 competitors per page, with competitor data refreshed daily
Yes, 30-day free trial
Analytics add-on: $14 per workspace/month
Hootsuite
Cross-platform competitor benchmarking. Tracks posting frequency, follower growth, engagement, and post performance.
Yes, 14-day free trial
Standard: $99 per user/month
Sprout Social
Competitor reports for Instagram, Facebook, and X, including audience growth, engagement, post volume, and content performance
Yes, 30-day free trial
Professional: $299 per seat/month
Rival IQ
Competitive benchmarking across Facebook, Instagram, TikTok, X, YouTube, and LinkedIn. Drive tracks up to 10 companies and includes competitive social metrics and content analysis
Yes, 14-day free trial
Drive: $239/month
Brandwatch
Tracks competitor mentions and broader market conversations. It is more focused on listening and brand monitoring than direct side-by-side social competitor benchmarking
No free plan. Free demo available
Custom pricing
Coverage
Instagram, Facebook, YouTube, TikTok, and LinkedIn. Track up to 5 competitors per page, with competitor data refreshed daily
Free tier or trial
Yes, 30-day free trial
Starting price
Analytics add-on: $14 per workspace/month
Coverage
Cross-platform competitor benchmarking. Tracks posting frequency, follower growth, engagement, and post performance.
Free tier or trial
Yes, 14-day free trial
Starting price
Standard: $99 per user/month
Coverage
Competitor reports for Instagram, Facebook, and X, including audience growth, engagement, post volume, and content performance
Free tier or trial
Yes, 30-day free trial
Starting price
Professional: $299 per seat/month
Coverage
Competitive benchmarking across Facebook, Instagram, TikTok, X, YouTube, and LinkedIn. Drive tracks up to 10 companies and includes competitive social metrics and content analysis
Free tier or trial
Yes, 14-day free trial
Starting price
Drive: $239/month
Coverage
Tracks competitor mentions and broader market conversations. It is more focused on listening and brand monitoring than direct side-by-side social competitor benchmarking
Free tier or trial
No free plan. Free demo available
Starting price
Custom pricing
FAQs
How many competitors should you track?
Three to five. That’s enough to spot a pattern and few enough to re-run every month without the analysis turning into a second job. Keep the set steady between rounds so your numbers stay comparable quarter to quarter.
How often should you run a social media competitor analysis?
Track the core numbers monthly and run the full analysis quarterly. Benchmarks move fast enough to matter inside a year. A quarterly re-run catches a shift like that while you can still act on it.
What does Planable’s competitor analysis cover?
Planable supports competitor analysis for Instagram, Facebook, YouTube, TikTok, and LinkedIn. You can track up to five competitors per page, and competitor data is refreshed once a day.
Turn your competitor analysis into next month’s content plan
A competitor analysis is only worth the hours if something changes in next month’s calendar. The step between the two is packaging: the comparison numbers and the posting patterns worth copying, written up as a social media report a client or a leadership team can read without you narrating it.
Then it has to become a post someone publishes. In Planable, those findings turn into dated campaigns, with the team’s comments and the client’s approval attached to the post itself. Try it yourself!
As a senior product marketer, Monica leads product marketing campaigns, drives competitive intelligence initiatives, and contributes to Planable’s growth strategy through extensive user research and data analysis.