Global & US Data (Updated)
20.3% of retail eCommerce sales are projected to occur online, totaling around $6.88 trillion globally.
Additionally, approximately 2.86 billion people are expected to shop online, showcasing the extensive adoption of e-commerce worldwide.
In this article, we will explore the details regarding the number of online shoppers, the growth of eCommerce websites, sales figures, and other interesting statistics that shape the eCommerce industry.
eCommerce Statistics 2026: Top Picks
- 2.86 billion are estimated to make online purchases this year.
- It’s projected that 1 in 5 purchases will be made through eCommerce businesses.
- The average e-commerce conversion rate in the United States is 2.6%.
- eCommerce is estimated to account for 16.6% of US retail sales in 2024.
- Global eCommerce sales are expected to reach $6.88 trillion worldwide2026.
- Most social commerce buyers (19%) prefer Facebook for online purchases.
How Big Is The eCommerce Market?
The retail e-commerce sales are predicted to reach $7,886 million by 2028
The revenue of e-commerce retail sales was recorded to be $6,419 million in 2025.
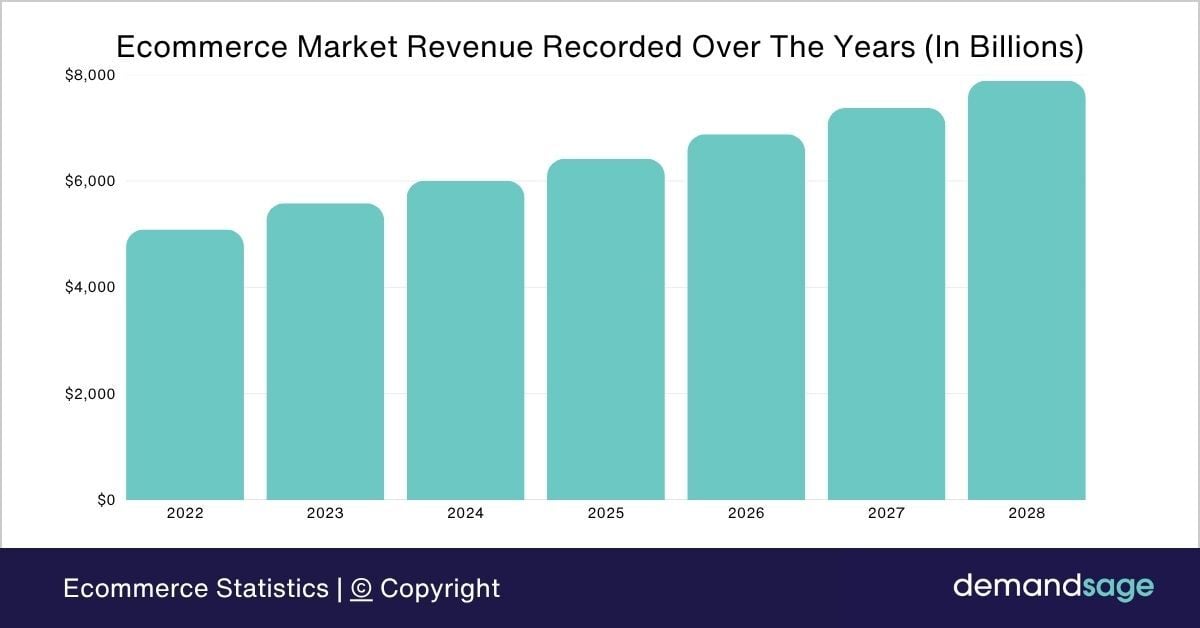
The following table displays the market revenue of e-commerce recorded over the years.
| Year | Retail Ecommerce sales |
|---|---|
| 2022 | $5,090 million |
| 2023 | $5,580 million |
| 2024 | $6,007 million |
| 2025 | $6,419 million |
| 2026 | $6,880 million |
| 2027 | $7,375 million |
| 2028 | $7,886 million |
Source: EMarketer
How Many People Shop Online?
In 2026, approximately 2.86 billion people around the globe will shop online, contributing to the growth of the e-commerce sector. This represents an increase from the 2.77 billion online shoppers reported in 2025.
| Year | Number Of People That Shop Online |
|---|---|
| 2026 | 2.86 billion |
| 2025 | 2.77 billion |
| 2024 | 2.71 billion |
| 2023 | 2.64 billion |
| 2022 | 2.56 billion |
| 2021 | 2.48 billion |
| 2020 | 2.37 billion |
Source: Oberlo, Sellers Commerce
How Many eCommerce Sites Are There?
28 million eCommerce sites worldwide in 2026.
This significant number reflects the growing trend of online shopping and the expansion of digital marketplaces.
The United States leads the way with 13.34 million eCommerce sites, making up nearly half of all eCommerce platforms. This highlights the country’s major impact on the global online retail market.
Following closely is the United Kingdom, which ranks second with approximately 1.27 million eCommerce sites.

Here is a table displaying the countries with the highest number of e-commerce websites:
| Country | Number of eCommerce Sites |
|---|---|
| United States | 13,336,093 |
| United Kingdom | 1,272,169 |
| Brazil | 811,144 |
| Germany | 728,733 |
| Australia | 691,748 |
| France | 573,215 |
| Russia | 541,991 |
| Canada | 482,723 |
| Italy | 479,145 |
| India | 478,424 |
Source: USA Today, Social Commerce
eCommerce Sales
U.S. Retail E-commerce Sales Reached $326.7 Billion in the First Quarter of 2026
According to the U.S. Census Bureau, seasonally adjusted U.S. retail e-commerce sales were estimated at $326.7 billion in the first quarter of 2026. This represents a 2.7% increase compared to the fourth quarter of 2025 and a 9.8% increase from the first quarter of 2025.
Total U.S. retail sales for the first quarter of 2026 were estimated at $1.929 trillion, up 1.5% from the previous quarter and 3.9% year over year. E-commerce accounted for 16.9% of total retail sales, highlighting the continued expansion of online shopping relative to the broader retail market.
On a non-seasonally adjusted basis, U.S. retail e-commerce sales totaled $302.3 billion in the first quarter of 2026. Although this represented a 17.2% decline from the fourth quarter of 2025 due to typical seasonal patterns, sales were still 9.7% higher than in the first quarter of 2025. On this basis, e-commerce represented 16.8% of total retail sales.
Source: United States Census Bureau.
US eCommerce Sales Will Settle Back Into Their Pre-Pandemic Trajectories, With Online Sales Growing By 9.3% In 2023 To Reach $1.137 Trillion.
Online sales in the United States grew by 36.7% in 2020. This was when the pandemic was at its peak, and most parts of the world were locked in their house.
However, once the lockdown was lifted, e-commerce sales in the United States declined by 17.3% and 8.5% in 2021 and 2022, respectively.
Retail e-commerce sales in the United States will reach $1.72 trillion by 2027.

The following table displays the value of US retail e-commerce sales recorded over the years:
| Year | Value of US Retail e-commerce Sales |
|---|---|
| 2027 | $1.72 trillion |
| 2026 | $1.54 trillion |
| 2025 | $1.39 trillion |
| 2024 | $1.256 trillion |
| 2023 | $1.137 trillion |
| 2022 | $1.04 trillion |
| 2021 | $0.96 trillion |
| 2020 | $0.82 trillion |
| 2019 | $0.59 trillion |
Source: Insider Intelligence.
As eCommerce sale continue to grow, the business opportunity to become a seller also has a lot of potential. You can use 40% discount on Helium 10 and begin your journey today!
US Online Shopping Statistics
The Number Of Online Buyers In The United States is estimated to have reached 288.2 Million In 2026.
Meanwhile, 284.6 million people in the United States shopped online in 2025.
That means more than 81% of consumers in the United States prefer to shop online.
The number of online shoppers in the US increased from 268.20 million in 2022 to 274.70 million in 2023. This is an approximate increase of 4 billion shoppers in the country within a year.
The following table displays the number of online shoppers recorded over the years in the United States.
| Year | Number of Online Buyers In The United States |
|---|---|
| 2026* | 288.20 million |
| 2025 | 284.60 million |
| 2024 | 279.90 million |
| 2023 | 274.70 million |
| 2022 | 268.20 million |
| 2021 | 264.50 million |
| 2020 | 252.70 million |
| 2019 | 243.60 million |
| 2018 | 234.80 million |
Source: Statista, Landmark Global
eCommerce Conversion Rates
On average, the conversion rates of e-commerce websites are recorded between 2% and 3%. However, to run a successful e-commerce store, aiming for a conversion rate higher than 3% is ideal.
Here are the latest figures about conversion rates recorded in the e-commerce industry.
An Average E-Commerce Conversion Rate Is Around 2.5% To 3%
If you are doing everything right for your online store, then you must be able to gain an average conversion rate between 2.5% and 3%.
Source: Shopify.
Desktops Have An Average Conversion Rate Of 1.9%, While Smartphones Have An Average Of 1.2%
Desktops and tablets have higher conversion rates than smartphones, even though e-commerce stores receive most of the traffic from smartphones.
This is because shoppers prefer to use smartphones primarily for research purposes and make the final purchase from their desktops or laptops.
However, these numbers may vary according to the location. For example, almost half of all online sales in the United Kingdom are made through smartphones, and 61% of e-commerce sales in Japan happen on mobile devices.
Source: Adobe Experience Cloud, Propel
Food And Beverages Have The Highest E-Commerce Conversion Rates, At 4.6%
The average e-commerce conversion rates differ according to the industry. Food and beverages and health and beauty have the highest e-commerce conversion rates.
One of the reasons for higher conversion rates in these industries is that the products cost less than the other industries.
Household goods and electronics cost more and, hence, have lower conversion rates than other industries.
The following table displays the average conversion rate recorded in the top e-commerce industries.
| Industry | Average Conversion Rates |
|---|---|
| Fashion and apparel | 2.7% |
| Health and beauty | 3.3% |
| Entertainment | 2.5% |
| Household goods | 2.1% |
| Electronics | 1.9% |
| Food and beverage | 4.6% |
Source: Adobe.
Social Commerce Statistics
46% of digital buyers prefer using Facebook for online shopping, 21% favor Instagram, and 26% choose TikTok Shop.
In contrast, only 5% of digital buyers prefer WhatsApp for online shopping.
Here is a table displaying the share of digital buyers preferring various social media platforms for online shopping.
| Social Media Platform | Percentage of Respondents |
|---|---|
| 46% | |
| TikTok Shop | 26% |
| 21% | |
| 16% | |
| Snapchat | 6% |
| 5% | |
| Other | 29% |
Source: Hostinger
Social commerce is estimated at 15.2% of total global e-commerce in 2026, nearly $586 billion in sales. This share is projected to grow modestly to 19.1% by 2030.
Below you can see the growth of social commerce as a share of total e-commerce worldwide:
| Year | Share of e-commerce |
|---|---|
| 2030 | 19.10% |
| 2029 | 18.20% |
| 2028 | 17.30% |
| 2027 | 16.30% |
| 2026 | 15.20% |
| 2025 | 13.80% |
| 2024 | 12.90% |
| 2023 | 11.90% |
| 2022 | 10% |
| 2021 | 8% |
| 2020 | 7.00% |
| 2019 | 5.70% |
| 2018 | 4.20% |
Source: Statista.
59% Of Consumers Worldwide Have Used Social Media To Make A Purchase
On average, 1.212 billion online shoppers buy something on Facebook Marketplace. This is approximately equal to 40% of Facebook’s 3.03 billion monthly users.
Besides, 24.5% of consumers have made retail purchases on Instagram. Plus, 200 million Instagram users tap on a shopping post or business profiles daily.
Source: Insider Intelligence, Capital One Shopping.
In 2026, the United States will have 117.1 Million Social Buyers
Further, in 2024, Facebook is the top platform for social commerce in the US, with 64.6 million buyers.
It will be followed by Instagram and TikTok, with 46.8 million and 40.7 million social buyers.
In 2023, the United States had 106.8 million social buyers, an increase of over 4 million from the previous year.
With the increased adoption of social media platforms, the internet, and smartphones by 2027, this figure is anticipated to reach 118.1 million.
Hence, an increase of nearly 12 million social commerce shoppers is expected to be recorded between 2023 and 2027.
The following table displays the number of social shoppers in the United States recorded over the years.
| Year | Number of Social Buyers In The United States |
|---|---|
| 2027* | 118.1 million |
| 2026* | 115.8 million |
| 2025* | 113.2 million |
| 2024* | 110.4 million |
| 2023 | 106.8 million |
| 2022 | 102.6 million |
| 2021 | 96.9 million |
Source: Statista, Insider Intelligence.
Social Commerce Is Most Popular Among Genzs
The highest number of Social media purchases is made by adults in the age group of 18 to 34 years.
Almost one in four adults aged 18 to 34 purchase products from Facebook, Instagram, and YouTube.
Adults aged between 55 and 65 trust Facebook to purchase goods over other social media platforms.

The following table displays the most popular social media platforms among different age groups in the United States.
| Social Media Platform | 18 to 34 Years | 35 to 54 Years | 55 to 65 Years |
|---|---|---|---|
| 26.8% | 20% | 15.6% | |
| 27.2% | 7.3% | 2% | |
| YouTube | 22.8% | 6.3% | 4.1% |
| TikTok | 19.5% | 4.7% | 1.4% |
| 11.4% | 3.3% | 1% | |
| 9.2% | 4.7% | 1.7% |
Source: Statista.
Mobile eCommerce Statistics
79% of smartphone users have used their devices to make a purchase online. This means more than 3 in 4 mobile users prefer online shopping.
Let’s take a look at some of the most fascinating figures about mobile commerce.
45% Of Consumers Worldwide Use Their Phones To Shop At least Once A Day
29.9% of the world’s online shoppers make a purchase on their smartphones at least once per week.
Smartphones have redefined the shopping landscape over the past years. Consumers can purchase a product just with some taps at any time and anywhere.
Besides, mobile shopping is most popular in the APAC market, with 51% of consumers purchasing through mobile.
Source: YouGov. Capital One Shopping
60.9% of the US population shops through mobile phones
This equals 167.8 million mobile shoppers in the United States. This number is predicted to grow up to 209.3 million in 2030.
Source: Zippia.
Shopping Cart Abandonment Statistics
Nearly 7 in 10 online shoppers abandon their carts after adding the products. The reasons for cart abandonment may vary according to the industry.
However, some major reasons are heavy taxes, hefty delivery fees, and more. Here are further facts about shopping cart abandonment.
70.22% Of The Online Shopping Carts Are Abandoned
Cart abandonment has become very common as most offline shoppers research online for their purchases and add the products they like to the cart.
Seven of every ten customers who add an item to their shopping cart leave without completing the purchase. These abandoned carts cost $18 billion in sales revenue annually to the e-commerce stores.
These cart abandonment rates peak in December during the Black Friday and Cyber Monday sales.
Source: Bigcommerce, Baymard
The Finance Industry Has The Highest Cart Abandonment Rate Of 83.6%
This is followed by the travel industry, which has 81.7% of the abandonment rates.
These high abandonment rates are due to increased costs in the industry. The higher the cost of products in the industry, the higher the cart abandonment rates will be.
Consumers think twice before purchasing goods that will cost them a good amount.
Some of the industries with the highest cart abandonment rates are:
- Finance – 83.6%
- Travel – 81.7%
- Non-profits – 83.1%
- Retail – 72.8%
- Fashion – 68.3%
- Gaming – 64.2%
eCommerce Payment Statistics
Ecommerce payments have boosted online payments worldwide. Nearly 1 in 2 people use mobile wallets to make payments while shopping online.
Here are some of the latest figures about eCommerce payments worldwide.
Mobile Wallets Will Account For Almost 60% Of eCommerce Transactions By 2030
After mobile wallets, credit cards are the most preferred way of payment for online purchases.
Besides, 2% prefer to pay through cryptocurrency, prepaid, and postpay. At the same time, 1% to 2% of shoppers use the cash-on-delivery option.
Moreover, e-commerce has played a major role in the growth of the mobile payments market worldwide. The market is predicted to have grown at a CAGR of 25.7%, from $109.58 billion in 2023 to $137.73 billion in 2024.

The following table displays the market share of payment methods in total e-commerce transactions value worldwide.
| Payment Method | 2022 | 2026 |
|---|---|---|
| Digital wallet | 49% | 54% |
| Credit card | 20% | 16% |
| Debit card | 12% | 10% |
| Account-to-account (A2A) | 9% | 10% |
| Buy now, pay later (BNPL) | 5% | 6% |
| Other – incl. cryptocurrency, prepaid, PostPay | 2% | 2% |
| Cash on delivery | 2% | 1% |
| PrePay | 1% | 1% |
Source: Statista, Business Research Company.
76% Of Indians Prefer UPI As A Payment Mode While Shopping Online
UPI payments have changed the online shopping scenario in India. Today, over 1 in 4 Indians prefer to use UPI while shopping online.
UPI has around 330 million unique users and over 70 million merchants actively utilize UPI QR codes. PhonePe, Google Pay, and Paytm are the top UPI apps.
Source: CNBC TV.
eCommerce Fraud Statistics
eCommerce fraud cases increased by 16% in 2023. This increase is due to the rise in online shopping worldwide.
Let’s take a look at further statistics about eCommerce fraud.
E-Commerce Companies Lose An Average Of $48 Billion To Fraud Annually
E-commerce fraud rates have increased by 16% compared to the previous year. A major reason for the increase in the number of e-commerce frauds was the increased adoption of the ‘Buy now and pay later option. ’
Here are further details about the losses of e-commerce companies due to online payment fraud recorded over the years.
| Year | e-Commerce Losses To Online Payment Fraud |
|---|---|
| 2023 | 48 billion |
| 2022 | 41 billion |
| 2021 | 20 billion |
| 2020 | 17.5 billion |
Source: Juniper Research, Statista.
The Losses From Online Payments Are Projected To Exceed $362 Billion Globally Between 2023 And 2028
Alone in 2028, the e-commerce fraud losses are predicted to be $91 billion.
This growth in e-commerce fraud is driven by a rise in e-commerce transactions and the misuse of Artificial intelligence and machine learning.
eCommerce frauds like phishing, business email compromise, or account takeover have increased considerably over the past few years.
Source: Juniper Research.
Bonus: Check out our detailed report about e-commerce fraud statistics for further details.
Reseller eCommerce Statistics
The resale e-commerce market has seen rapid growth in recent years and is predicted to double between 2022 and 2027. Besides,10% of the global apparel market is expected to comprise secondhand apparel.
The Apparel Industry Will Have The Highest Resale Revenue Of $99.49 Billion.
The revenue of the second-hand consumer goods market is forecast to increase greatly across all categories from 2022 to 2026.
However, the apparel industry will experience the highest revenue growth between 2022 and 2026.
The consumer and electronics industry stands second in the revenue increase, followed by the hardware and furniture industry.
The following table displays the increase in revenue of second-hand consumer goods between 2022 and 2026.
| Industry | Revenue Generated By The Resale Industry In 2022 | Revenue Generated By The Resale Industry In 2026 |
|---|---|---|
| Apparel | 52.17 billion | 99.49 billion |
| Consumer electronics | 29.21 billion | 49.52 billion |
| DIY & hardware | 28.63 billion | 51.48 billion |
| Furniture | 13.43 billion | 27.04 billion |
| Accessories | 13.05 billion | 25.97 billion |
| Household appliances | 12.48 billion | 24.39 billion |
| Toys, hobbies & video games | 10.9 billion | 22.53 billion |
| Footwear | 10.38 billion | 20.92 billion |
| Luxury goods | 6.51 | 12.8 |
Source: Statista.
The Value Of e-commerce Resale In The United States Reached 89.81 Billion In 2024
Hence, the resale e-commerce volume is predicted to grow at a rate of 7.5% compared to the previous year.
In 2023, e-commerce resale volume in the United States was approximately 82.78 billion. Further, the forecasts suggest that online resales will surpass the 100 billion dollar mark, reaching 107.2 billion by 2026.
The following table details the volume of online resale and the growth rate recorded over the years.
| Year | Value Of e-commerce Resale | YoY Change |
|---|---|---|
| 2026* | 107.2 billion | 9.4 |
| 2025* | 97.99 billion | 9.1 |
| 2024* | 89.81 billion | 8.5 |
| 2023 | 82.78 billion | 7.5 |
| 2022 | 77 billion | -6.6 |
Source: Statista.
18% Of The Consumers Prefer Second-hand Sites For Purchasing Second-hand Goods
While 13% prefer marketplaces like eBay and 10% prefer social media sites for purchasing second-hand goods.
Notably, 17% of the consumers said they never buy second-hand products online.
Here are further details about the online channels consumers prefer to purchase second-hand products worldwide.
- Second-hand sites – 18%
- Other marketplaces (e.g. eBay)– 13%
- Social media sites – 10%
- Amazon – 8%
- Mercado Libre – 7%
- Retailer sites (e.g. John Lewis) – 4%
- Brand website – 4%
Source: Statista.
Small Business eCommerce Statistics
Most small businesses sell their products online to reach a large audience base. Nearly 2 in 5 online businesses have e-commerce stores or websites to sell their products online.
Here are some of the latest facts about small businesses selling their products online.
36% Of The Small Businesses Worldwide Make Sales Online
That means there is a huge room for growth in the market because 28% of the small businesses still do not have their website.
Besides, 26% of the small businesses in the United States have an e-commerce website.
Small businesses play a vital role in the e-commerce industry. They generate over 20% of the GDP in major economies like India and Russia.
Source: Zippia, Statista.
43% Of The Small Businesses Witnessed Sizable Revenue Growth With Online Sales
A survey conducted by Insureon and online small business directory Manta found that only 19% of businesses experienced no growth in revenue from selling products online.
Besides, 38% of small businesses reported a moderate revenue increase due to online sales.
Further, 81% of small businesses know online sales are important or very important to their business’s success.
66% of the small businesses used their company’s website to sell their products online, while 24% said they used Amazon to sell their products.
Here are further details about the platforms used by small businesses to sell their products online.
- Company website – 66%
- Amazon – 24%
- eBay – 22%
- Shopify – 7%
- Etsy – 4%
- Alibaba – 2%
- Jet – 2%
- Magento – 1%
Source: Insureon.
Conclusion: eCommerce Is Estimated To Represent One-Fifth of Retail Purchases
eCommerce sales are projected to surpass 20% of total retail sales globally, while in the United States, they are expected to account for 16.6% of retail sales.
The U.S. is anticipated to lead in eCommerce transactions, with an average conversion rate of 2.6%.
As internet access, smartphones, social media, and digitalization continue to expand, the eCommerce industry worldwide is set to grow even more.
This evolution will likely enhance the online shopping experience and drive more consumers toward digital purchasing options, making it an exciting time for retailers and shoppers.