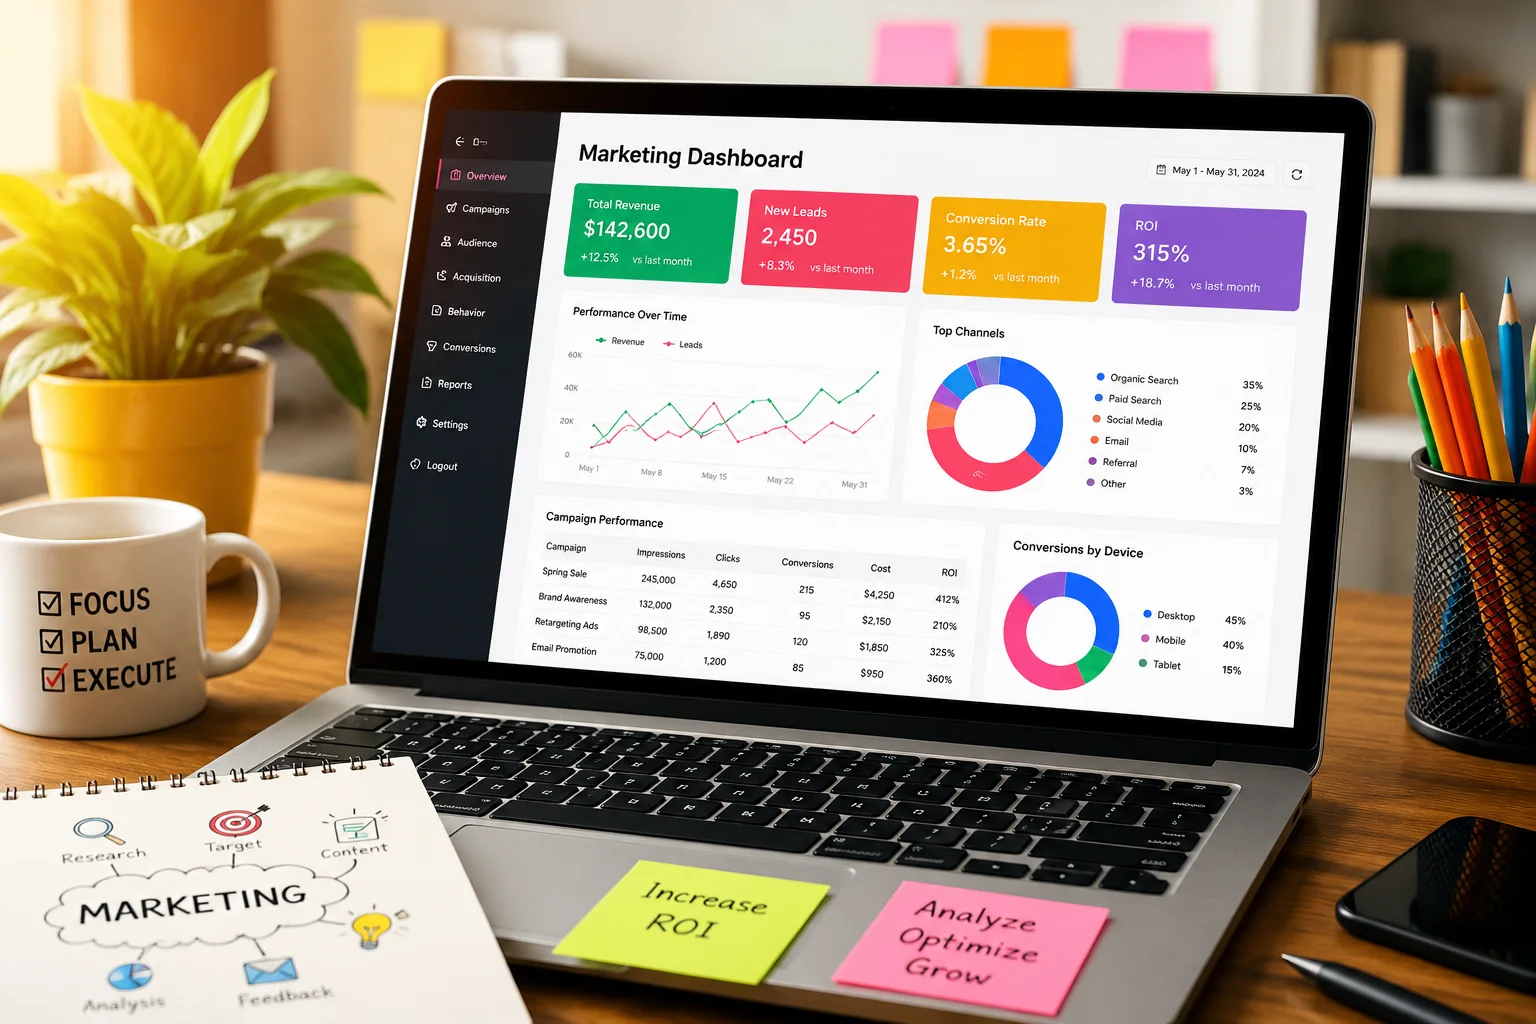
Marketing Dashboards
Marketing teams generate more data today than ever before. Paid search campaigns, email automation, social engagement, CRM activity, ecommerce tracking, attribution systems, and customer lifecycle analytics all produce streams of performance signals every minute.
The problem is rarely a lack of data.
It’s fragmentation.
A campaign manager might review Google Ads inside one platform, email performance in another, and revenue attribution somewhere else entirely. By the time reports are compiled, cleaned, exported, formatted, and shared, the opportunity to optimize the campaign may already be gone.
That’s exactly where marketing dashboards change the game.
Modern marketing dashboards give businesses a centralized way to monitor campaign performance, identify trends, detect inefficiencies, and make decisions faster. They transform scattered analytics into operational intelligence.
For agencies, dashboards reduce reporting labor and improve client transparency. For internal marketing teams, they create alignment between executives, analysts, and campaign managers. For growing businesses, they provide visibility into ROI without requiring massive business intelligence departments.
And from a commercial perspective, dashboard adoption has become tightly connected to broader investments in marketing analytics platforms, data warehousing, attribution software, CRM integrations, customer intelligence systems, and business intelligence marketing infrastructure.
What Marketing Dashboards Actually Do
At a basic level, a marketing dashboard is a visual reporting environment that aggregates campaign data from multiple sources into a centralized interface.
But that definition barely scratches the surface.
A high-performing dashboard system typically handles:
- Multi-channel data aggregation
- KPI monitoring
- Performance visualization
- Campaign attribution analysis
- Automated reporting
- Trend detection
- Budget pacing
- Conversion tracking
- Audience segmentation
- Executive reporting
- Forecasting support
Instead of manually exporting spreadsheets every week, marketers can instantly review performance metrics across channels in real time.
That operational speed matters more than most businesses realize.
A delayed insight often means wasted ad spend.
For example:
- A paid social campaign may show rising CPC trends within hours
- An email sequence may experience declining open rates after a deliverability issue
- A landing page conversion rate may collapse after a CMS update
- A retargeting audience may become oversaturated
Without dashboards, those issues can stay hidden for days.
With dashboards, optimization becomes continuous rather than reactive.
The Growing Complexity of Modern Marketing Analytics
Marketing used to be relatively linear.
Run television ads. Measure reach. Estimate sales impact.
Digital marketing completely changed measurement expectations.
Now businesses expect visibility into:
- Cost per acquisition (CPA)
- Return on ad spend (ROAS)
- Customer lifetime value (CLV)
- Multi-touch attribution
- Assisted conversions
- Pipeline contribution
- Lead quality scoring
- Engagement velocity
- Cohort retention
- Incrementality
- Revenue forecasting
The average marketing team may use:
- Google Analytics
- Google Ads
- Meta Ads
- LinkedIn Campaign Manager
- HubSpot
- Salesforce
- Shopify
- Looker Studio
- Tableau
- Power BI
- Snowflake
- Segment
- Klaviyo
- Mailchimp
- TikTok Ads
- Call tracking software
- Heatmapping tools
Each system produces different data structures, attribution models, APIs, and reporting limitations.
That creates reporting chaos.
Marketing dashboards solve this by acting as a unification layer between systems.
Instead of isolated analytics silos, teams gain a connected performance environment.
Core Components of Effective Marketing Dashboards
Not all dashboards are useful.
Some are overloaded with vanity metrics and colorful graphs that look impressive but provide little operational value.
Effective marketing dashboards focus on actionable intelligence.
KPI Visibility
The best dashboards surface core KPIs immediately.
Examples include:
- Conversion rate
- CAC
- ROAS
- Revenue
- Lead volume
- Qualified pipeline
- CTR
- Bounce rate
- Session quality
- Cost per lead
Executives need summary visibility.
Analysts need deeper drill-down capabilities.
Strong dashboard architecture supports both.
Real-Time Data Synchronization
Campaign optimization depends on speed.
Real-time or near-real-time reporting allows teams to:
- Pause underperforming campaigns quickly
- Reallocate budget faster
- Identify tracking failures immediately
- Detect attribution inconsistencies
- Respond to audience behavior changes
For ecommerce businesses running high-budget acquisition campaigns, even a few hours of reporting delay can materially impact profitability.
Data Visualization
Humans interpret patterns visually much faster than through spreadsheets.
Dashboards use:
- Trend lines
- Funnel views
- Heatmaps
- Comparative tables
- Cohort charts
- Geographic maps
- Attribution paths
- Scatter plots
Good visualization reduces cognitive load.
Bad visualization hides important signals.
Multi-Channel Attribution
One of the biggest advantages of modern marketing analytics platforms is attribution modeling.
Customers rarely convert after a single interaction.
A typical conversion journey might include:
- Organic search discovery
- Paid retargeting
- Email nurture
- Webinar attendance
- Branded search conversion
Dashboards help marketers understand how channels influence one another instead of evaluating campaigns in isolation.
How Dashboards Improve Campaign Performance Analysis
This is where dashboards move beyond convenience and become strategic assets.
Faster Decision-Making
Marketing campaigns are dynamic systems.
Performance shifts daily based on:
- Competition
- Seasonality
- Creative fatigue
- Audience saturation
- Algorithm changes
- Bid fluctuations
- Economic conditions
Dashboards shorten the time between signal detection and action.
That speed directly improves campaign efficiency.
A team reviewing dashboards daily can identify declining performance before losses compound.
Better Budget Allocation
One of the most common marketing problems is inefficient budget distribution.
Without unified reporting, teams often overinvest in channels that appear successful on the surface while undervaluing assisted-conversion channels.
Dashboards expose:
- Hidden acquisition costs
- Incremental revenue contribution
- Low-efficiency ad groups
- Geographic performance gaps
- Device-level conversion differences
- Funnel drop-off patterns
This improves media buying decisions significantly.
Improved Executive Communication
Executives typically want concise performance visibility.
Marketing teams often overwhelm leadership with unnecessary detail.
Dashboards bridge that communication gap.
A well-designed executive dashboard provides:
- Revenue impact
- Campaign ROI
- Pipeline influence
- Forecast pacing
- Growth trends
- Strategic channel insights
This improves stakeholder confidence and speeds up decision approval cycles.
Stronger Accountability
Dashboards create transparency.
When campaign metrics are visible organization-wide:
- Teams become more data-driven
- Optimization ownership improves
- Reporting manipulation becomes harder
- Performance conversations become objective
That cultural shift matters.
High-performing marketing organizations usually operate with shared visibility into performance data.
Real-Time Reporting vs Traditional Reporting
Traditional reporting workflows are painfully inefficient.
A common process looks like this:
- Export data from multiple platforms
- Clean spreadsheets manually
- Merge datasets
- Build charts
- Create presentation decks
- Send reports weekly or monthly
This consumes enormous operational time.
It also introduces human error.
Marketing dashboards automate much of this workflow.
Traditional Reporting Problems
Delayed Optimization
By the time reports reach stakeholders, the campaign may already be underperforming.
Data Inconsistency
Different teams often use different attribution windows and reporting logic.
Analyst Bottlenecks
Analysts spend more time preparing reports than interpreting them.
Scalability Issues
As marketing channels grow, spreadsheet workflows collapse under complexity.
Benefits of Dashboard-Based Reporting
Automation
Automated connectors eliminate repetitive exports.
Standardization
Shared KPI definitions improve organizational consistency.
Accessibility
Stakeholders access performance instantly.
Historical Trend Analysis
Dashboards preserve longitudinal campaign data for forecasting and benchmarking.
Marketing Dashboards for Different Business Types
Dashboard requirements vary significantly by business model.
Ecommerce Businesses
Ecommerce dashboards often prioritize:
- ROAS
- Average order value
- Product-level revenue
- Cart abandonment
- Customer acquisition cost
- Repeat purchase behavior
These businesses rely heavily on rapid optimization because paid acquisition costs fluctuate constantly.
B2B SaaS Companies
SaaS marketing dashboards usually focus on:
- Lead quality
- MQL-to-SQL conversion
- CAC payback period
- Pipeline velocity
- Subscription retention
- Expansion revenue
The sales cycle is longer, so attribution becomes more complex.
Agencies
Agencies need dashboards that support:
- Multi-client reporting
- White-label reporting
- Automated client updates
- Cross-platform integration
- Campaign benchmarking
Reporting efficiency directly affects agency profitability.
Enterprise Organizations
Enterprise marketing teams often require:
- Role-based permissions
- Data governance
- Warehouse integrations
- Advanced attribution
- Predictive analytics
- API extensibility
Their analytics infrastructure is usually much more complex.
Key Metrics Marketers Should Track
A dashboard is only as valuable as the metrics it prioritizes.
Tracking too many metrics creates noise.
Tracking too few creates blind spots.
Acquisition Metrics
These evaluate traffic generation efficiency.
Examples:
- CPC
- CPM
- CTR
- Cost per lead
- New users
- Traffic source performance
Engagement Metrics
These help assess content quality and audience alignment.
Examples:
- Bounce rate
- Time on site
- Scroll depth
- Video completion rate
- Pages per session
Conversion Metrics
These directly measure business outcomes.
Examples:
- Conversion rate
- Revenue
- Demo requests
- Purchases
- Qualified leads
Retention Metrics
Customer retention often matters more than acquisition volume.
Examples:
- Churn rate
- Repeat purchase frequency
- Subscription retention
- Customer lifetime value
Attribution Metrics
These explain how channels interact.
Examples:
- Assisted conversions
- First-touch attribution
- Last-touch attribution
- Multi-touch contribution
Cross-Channel Attribution and Unified Analytics
One of the biggest reporting failures in marketing is channel isolation.
Teams often optimize channels independently even though customer journeys are interconnected.
For example:
A user may:
- Discover a brand through YouTube
- Return via organic search
- Click a retargeting ad
- Convert after email nurturing
If attribution is fragmented, the business may incorrectly overvalue the final conversion channel.
Marketing dashboards help unify attribution models.
Common Attribution Models
Last-Click Attribution
Gives full credit to the final interaction.
Simple, but often misleading.
First-Click Attribution
Credits the original discovery source.
Useful for awareness analysis.
Linear Attribution
Distributes credit equally across touchpoints.
Time-Decay Attribution
Prioritizes interactions closer to conversion.
Data-Driven Attribution
Uses algorithmic weighting based on observed behavior patterns.
Advanced marketing analytics platforms increasingly rely on machine learning-based attribution systems.
Dashboard Workflows Used by High-Performing Marketing Teams
The most effective marketing teams don’t just “look at dashboards.”
They operationalize them.
Daily Monitoring
Teams often review:
- Spend pacing
- Conversion anomalies
- Technical tracking issues
- Creative fatigue indicators
Short daily reviews prevent budget waste.
Weekly Optimization Reviews
These focus on:
- Channel performance
- Audience segmentation
- Creative testing
- Funnel efficiency
- Attribution shifts
Monthly Executive Reporting
Leadership dashboards usually emphasize:
- ROI
- Revenue contribution
- Pipeline impact
- Growth trends
- Strategic recommendations
Quarterly Forecasting
Historical dashboard data improves forecasting accuracy.
Teams can identify:
- Seasonal trends
- Budget elasticity
- CAC inflation
- Demand fluctuations
Common Dashboard Mistakes That Hurt Reporting Accuracy
Not every dashboard improves decision-making.
Poor dashboard design can actually make analytics worse.
Vanity Metric Obsession
Metrics like impressions or follower counts may look impressive but fail to connect to business outcomes.
Dashboards should prioritize meaningful KPIs.
Too Much Complexity
Overloaded dashboards create analysis paralysis.
A good dashboard answers questions quickly.
Poor Data Hygiene
If tracking infrastructure is unreliable, dashboards become dangerous.
Broken UTMs, duplicate conversions, and inconsistent attribution models distort reporting accuracy.
Lack of Context
Raw metrics without benchmarks are hard to interpret.
For example:
A 2.5% conversion rate means little without historical comparison or industry context.
Ignoring Qualitative Insights
Dashboards are quantitative tools.
But campaign analysis also requires:
- Customer feedback
- Sales team insights
- Creative evaluation
- Market conditions
The best marketers combine analytics with human judgment.
How AI and Automation Are Changing Marketing Intelligence
AI is rapidly transforming dashboard capabilities.
Modern business intelligence marketing systems increasingly support:
- Predictive analytics
- Automated anomaly detection
- AI-generated summaries
- Forecasting models
- Audience clustering
- Conversion prediction
- Budget optimization recommendations
Instead of merely visualizing data, dashboards are becoming decision-support systems.
Predictive Campaign Analysis
AI models can estimate:
- Likely ROAS outcomes
- Conversion probability
- Audience saturation risk
- Churn likelihood
- Lead qualification probability
This changes dashboards from reactive tools into proactive intelligence systems.
Natural Language Querying
Some platforms now allow users to ask questions conversationally.
Example:
“Which campaigns drove the highest pipeline growth last quarter?”
The system automatically generates the analysis.
Automated Reporting Narratives
AI-generated summaries help executives interpret trends quickly without manually reviewing charts.
Comparing Marketing Analytics Platforms
Different platforms serve different operational needs.
Looker Studio
Popular for:
- Google ecosystem integrations
- Lightweight reporting
- Cost efficiency
Limitations:
- Complex enterprise workflows
- Advanced modeling constraints
Tableau
Strong for:
- Advanced visualization
- Enterprise analytics
- Deep data exploration
Limitations:
- Steeper learning curve
- Higher implementation complexity
Power BI
Popular among enterprise Microsoft environments.
Strong integration with:
- Azure
- Excel
- Dynamics
- SQL infrastructure
HubSpot Dashboards
Useful for:
- CRM-integrated marketing reporting
- Mid-market teams
- Inbound marketing workflows
Custom BI Dashboards
Larger organizations increasingly build custom reporting layers on top of:
- Snowflake
- BigQuery
- Redshift
- Databricks
This provides maximum flexibility but requires strong data engineering support.
Security, Governance, and Data Reliability Considerations
As dashboards become operationally critical, governance becomes more important.
Access Control
Not every user should access all reporting layers.
Role-based permissions protect sensitive business data.
Data Consistency
Centralized KPI definitions prevent organizational confusion.
Without governance, teams may calculate metrics differently.
API Reliability
Many dashboards rely on external APIs.
Platform outages or sync failures can disrupt reporting accuracy.
Compliance Requirements
Businesses operating in regulated environments may need compliance support for:
- GDPR
- CCPA
- HIPAA
- SOC 2
Data privacy increasingly affects marketing analytics architecture.
Dashboard Implementation Best Practices
Dashboard adoption often fails because businesses focus on tools before strategy.
Start With Business Questions
Before building dashboards, define:
- What decisions need support?
- Which KPIs matter most?
- Who uses the dashboard?
- How often are decisions made?
Avoid Dashboard Sprawl
Too many dashboards create confusion.
Standardize reporting where possible.
Align Metrics Across Teams
Sales, marketing, finance, and operations should share metric definitions.
Misalignment creates reporting distrust.
Build Tiered Reporting
Different users need different detail levels.
For example:
- Executives need summaries
- Analysts need drill-down access
- Campaign managers need operational metrics
Audit Tracking Regularly
Even sophisticated dashboards fail if tracking breaks.
Regular QA processes are essential.
Marketing Dashboard Use Cases by Industry
Retail
Retail marketers use dashboards to monitor:
- Product demand
- Seasonal performance
- Inventory-driven campaigns
- Omni-channel attribution
Healthcare
Healthcare marketing dashboards often emphasize:
- Lead compliance
- Patient acquisition
- Appointment conversion
- Regional performance
Finance
Financial services teams track:
- Lead qualification
- Customer acquisition cost
- Conversion compliance
- Funnel abandonment
SaaS
SaaS organizations prioritize:
- Trial conversions
- Retention
- Revenue expansion
- Product-qualified leads
Education
Education marketers monitor:
- Enrollment funnels
- Application completion
- Geographic targeting
- Student engagement
Future Trends in Business Intelligence Marketing
The dashboard landscape is evolving quickly.
Several trends are reshaping marketing analytics infrastructure.
Unified Data Warehousing
More businesses are consolidating analytics into centralized cloud warehouses.
This improves:
- Attribution consistency
- Historical analysis
- AI readiness
Privacy-Centric Analytics
Cookie deprecation is changing measurement models.
Dashboards increasingly rely on:
- First-party data
- Server-side tracking
- Modeled attribution
AI-Augmented Optimization
AI systems will continue automating:
- Forecasting
- Budget allocation
- Audience analysis
- Creative testing insights
Embedded Analytics
More SaaS platforms now integrate dashboards directly into operational workflows.
Analytics is becoming embedded rather than isolated.
FAQ
What are marketing dashboards used for?
Marketing dashboards centralize campaign data from multiple channels so businesses can monitor KPIs, analyze performance, track ROI, and optimize campaigns faster.
How do marketing dashboards improve campaign reporting?
They automate reporting workflows, reduce manual spreadsheet work, improve data visibility, and help teams identify performance issues in real time.
What metrics should be included in a marketing dashboard?
Common metrics include:
ROAS
CAC
Conversion rate
CTR
Revenue
Lead quality
Attribution data
Customer lifetime value
The ideal metrics depend on the business model and campaign objectives.
Are marketing dashboards only for large companies?
No. Small businesses, agencies, ecommerce brands, and startups also benefit from dashboard reporting because it improves operational efficiency and decision-making speed.
What’s the difference between dashboards and traditional reports?
Traditional reports are static and periodic. Dashboards are dynamic, interactive, and often updated in real time.
Which marketing analytics platforms are most popular?
Common platforms include:
Looker Studio
Tableau
Power BI
HubSpot
Domo
Klipfolio
Databox
Larger enterprises may also use custom BI infrastructure.
How do dashboards help with attribution?
Dashboards unify data across channels and apply attribution models that show how different touchpoints contribute to conversions.
Can AI improve marketing dashboards?
Yes. AI can automate anomaly detection, forecasting, audience segmentation, and campaign optimization recommendations.
Conclusion
Marketing dashboards have evolved far beyond simple reporting tools.
They now function as operational intelligence systems that help businesses interpret complex campaign data, optimize spend allocation, improve attribution accuracy, and accelerate decision-making.
As marketing ecosystems become more fragmented and data-intensive, centralized analytics visibility becomes a competitive advantage rather than a convenience.
The organizations gaining the most value from dashboards are usually the ones treating analytics as an active decision framework — not just a reporting exercise.
And with AI, automation, predictive modeling, and unified data infrastructure continuing to evolve, marketing dashboards are becoming central to how modern businesses manage growth.